- UX Design
- Churn
UX Case Study: Data-Driven Redesign to Reduce Churn
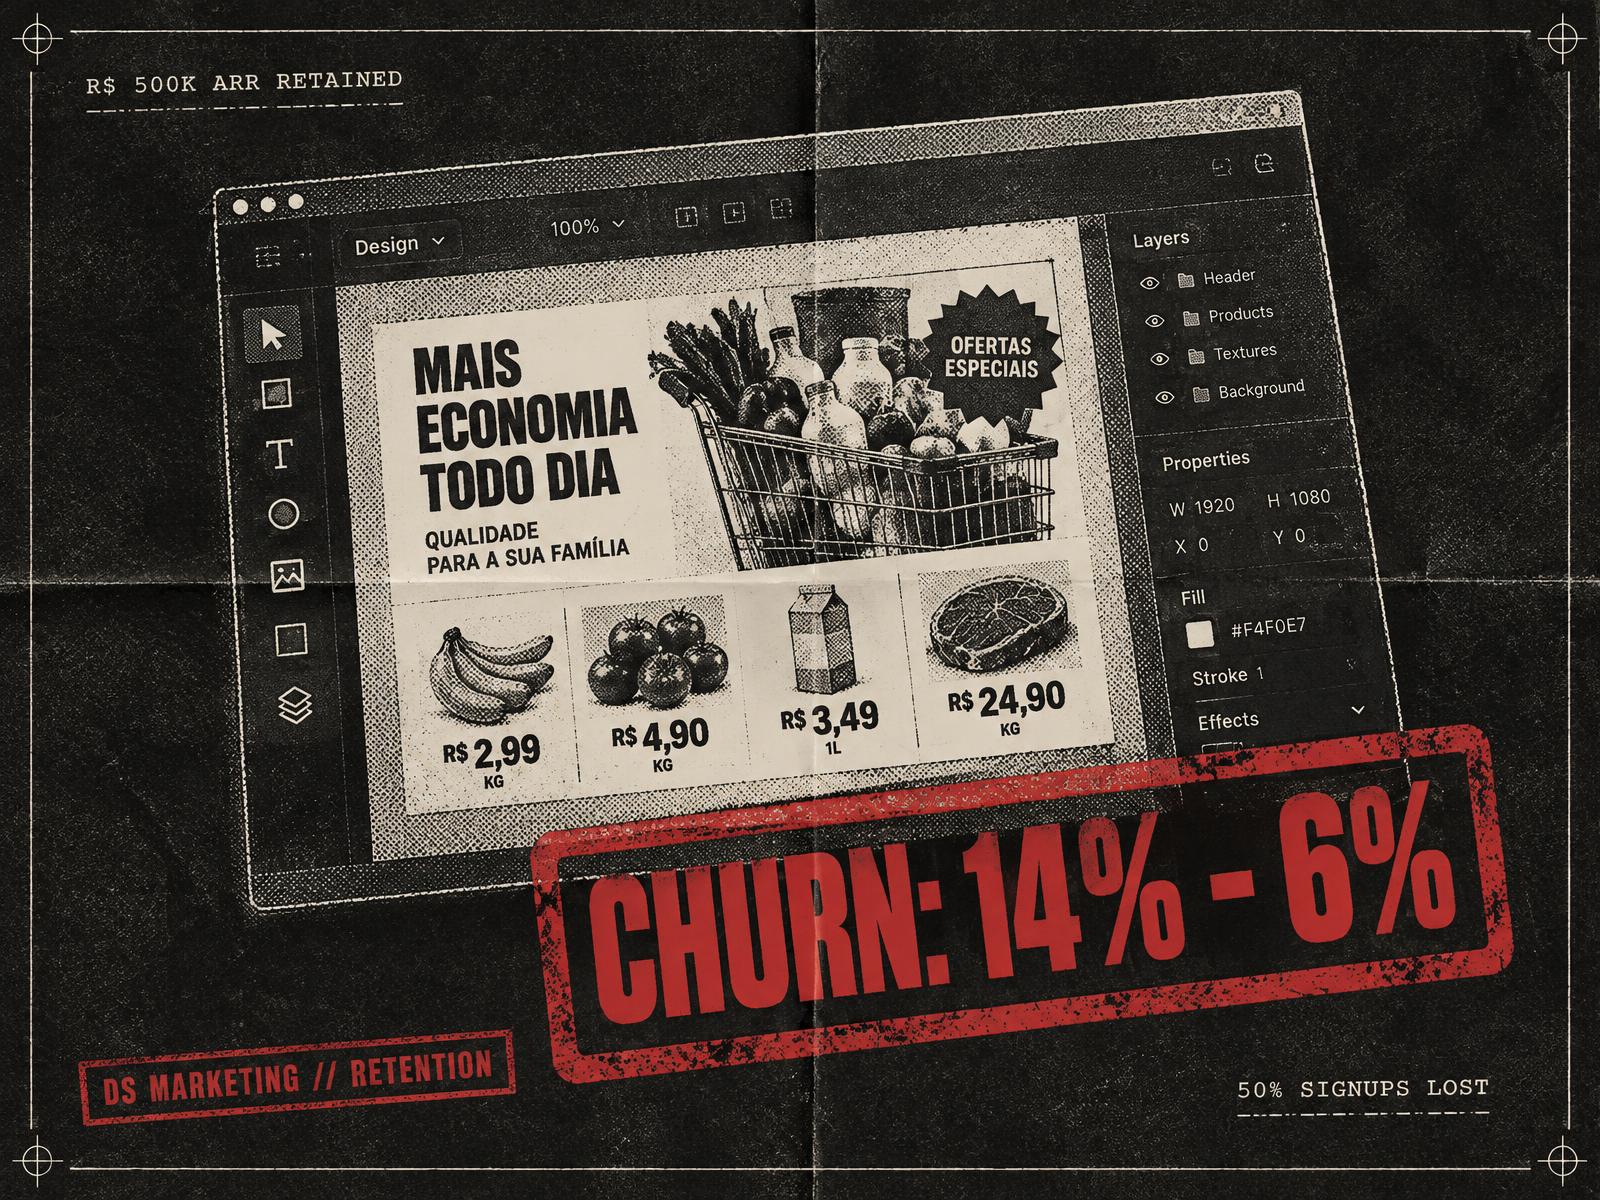
From a rigid wizard to a familiar canvas: how DS Marketing cut monthly churn from 14% to 6%.

Murilo Viriato
2 min read · 2023
Executive Summary
In 2023, DS Marketing (a B2C SaaS platform enabling supermarkets and pharmacies to generate marketing flyers rapidly) faced a critical retention challenge, with monthly churn fluctuating between 10% and 14%. This high drop-off rate threatened the long-term sustainability of the business.
As Product Owner and Product Designer, I led a cross-functional initiative spanning research, product strategy, and UX redesign. By shifting our core interface from an unfamiliar step-by-step wizard to an intuitive, industry-standard canvas model, we stabilized and reduced monthly churn down to 6%, preserving significant monthly revenue and recovering over R$ 500,000 in ARR.
1. The Challenge & Business Impact
DS Marketing generates over R$ 800k in Monthly Recurrent Revenue (MRR). However, erratic churn rates averaging 12% per month meant losing over 50% of new signups within their first few months.
Key Business Risks:
- Unrealized LTV: New clients canceled before reaching their break-even point.
- High Financial Loss: In a SaaS model of this scale, each 1% reduction in churn was worth nearly R$ 1,000,000 annually.
- Product Risk: Without structural changes, customer acquisition costs (CAC) would become unsustainable.
2. Discovery & Research
To understand the root causes behind early cancellations, I conducted an internal diagnostic alongside cross-functional team discovery.
Research Methodology:
- Internal Stakeholder & CS Alignment: Shadowed Support and Customer Success teams to categorize recurring user feedback and friction points.
- Qualitative User Interviews: Conducted in-depth interviews with active and former clients to identify drop-off drivers.
- Desk Research & Product Audits: Evaluated usage patterns and feature adoption across the platform.
Key Insights:
- Unfamiliar UX Architecture: Unlike industry standards (e.g., Canva, Adobe) that use a left toolbar and right canvas, our platform relied on a rigid step-by-step form wizard. Intended to simplify creation, it actually restricted flexibility and created cognitive friction.
- Feature Overload & Clutter: Unused tools diluted the core value proposition, making onboarding harder than necessary.
- Perceived Value Disconnect: Low product engagement during onboarding directly correlated with early subscription cancellations within 30 to 60 days.
3. UX Strategy & Solution
In collaboration with engineering leadership, we embarked on a complete overhaul of the core design experience.
Strategic Product Decisions:
- Adopted Industry Mental Models: Replaced the wizard layout with a familiar two-column architecture (left-hand tool menu, central canvas) to eliminate the learning curve.
- Streamlined Core Workflows: Optimized the flyer generation engine so users could build a 30-product promotional flyer in under 5 minutes without manual formatting barriers.
- Eliminated Feature Bloat: Deprecated low-engagement features to focus the UI on high-frequency, high-value user tasks.
4. Results & Business Impact
The redesigned platform was deployed with continuous feedback loops across business, tech, design, and CS teams.
- Churn Reduction: Monthly churn steadily decreased from a peak of 14% down to a stable 6%.
- Revenue Retention: Reduced monthly revenue loss by 50% (from losing ~R$ 80k/month down to ~R$ 40k/month).
- Financial Impact: Generated an estimated retention value exceeding R$ 500,000 in ARR.
- User Onboarding: Significantly reduced friction for non-technical users in supermarkets and pharmacies.